Appendix
Report Designer Reference Information
This topic provides reference information regarding the layout, features, and functionality available with the inline Report Designer tool. For more information see Using the Report Designer.
Click an option below to see additional details.
 Report Designer Functionality
There are over 200 reports provided with JobBOSS2 and all of them can be modified to suit an individual company’s needs. Examples of what the built in Report Designer can be used for include the following:
- Add company branding
- Reorganize the layout of data on a report
- Add data from the database that is not normally included in the standard report
- This function is not included by support.
- Create / edit formulas
- Apply conditional reporting
A report can have as many modified versions as needed; however the standard version of any report that is included in JobBOSS2 cannot be removed by saving a modified report by its standard name.
Access to the Report Designer can be restricted to specific users; see Accessing the Report Designer immediately below for details.
Reports created by ECI Software Solutions, Inc.'s Custom Development Team cannot be edited or modified using the Report Designer.
Accessing the Report Designer
The Report Designer is available for use on any report or form that can be generated from within JobBOSS2. The Quote form is used here as an example.
- In the Navigation Sidebar, click the Data Entry button.

- Open the Quoting drop down menu.
- Select Quotations.
- Select a Quote from the Quotations Navigator Grid.
- The Report Designer will not open if a record has not been selected.
- Click Print (located at the top of the page.)
-Small.png)
- Click Quote.
- Click Single Quote (green button.)
- Click Design.
Users must have the option to create custom reports enabled in order to access the Report Designer.
- Click the Settings button.

- Open the System dropdown menu.
- Select User Maintenance.
- Select the user from the User Grid.
- Click Edit (located at the top of the page.)
- Navigate to the Misc. Settings Section.
- Place a check in "Allow user to create custom reports".
- When blank users will not see the Design option when generating reports.
- Click Save to save the change.
The Report Designer tool opens in a separate browser tab, displaying the Report Designer User Interface.
Though the path to get there will vary, clicking "Design" when selecting an output option will open the Report Designer for the selected report, form, or label.
Report Designer User Interface (UI)
The User Interface, or UI, is made up of the following components:
- The Ribbon Menu
- Panels
- The Toolbox
- The Report Workspace
Click a subtopic below to see an overview of the options available.
The Ribbon Menu
The Ribbon Menu provides quick access to many tools used to determine how information appears on a report.
The Home Tab
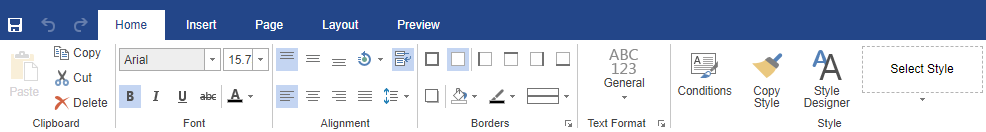
This tab contains the most commonly used commands with regards to working with a report, such as the ability to select fonts, sizes, and colors, in addition to many formatting options.
- Click the Save Report icon.
- Provide a File Name in the Save Report prompt that appears.
- Provide a name that helps identify what the modified report was designed to do since this is the value that will be used to select the report / form for use in the future.
- A modified report cannot overwrite a standard report included with JobBOSS2.
- If an existing modified report is being edited, saving it by the same name will overwrite the previous version of the modified report.
- Saving it with a different name will create another modified report that would be available to generate.
- Click Save.
- A prompt appears notifying the user the "report was successfully saved."
- Click OK.
Standard reports cannot be removed by saving a modified report with the same "standard" name, meaning standard reports will always be available for use.
Modified reports can be accessed for generating or editing by selecting them in the "Custom" dropdown menu that will appear in the Print Spool window once a modified report has been created / saved.
The Insert Tab
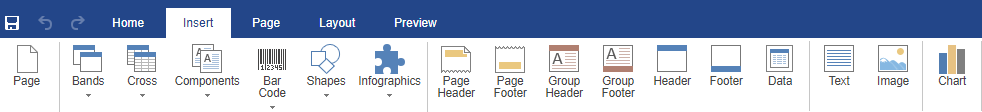
This tab is used to insert various items such as images, charts, headers, and footers.
The Page Tab
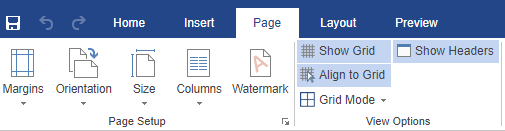
This tab is used to control various page related parameters such as orientation and size.
The Layout Tab
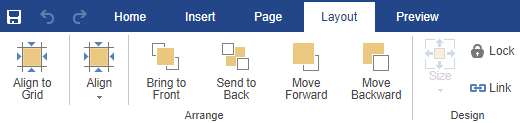
This tab is used to control where and in what order various elements on a page will display.
Panels
Panels contain different properties, functions, and commands used to control various components of a report such as user notifications and hints, as well as providing visual information regarding the relationships between various elements of the report.
Properties Panel
This panel shows all the properties of the selected component along with any associated events. Since it is component specific, the options available will vary depending on the component selected.
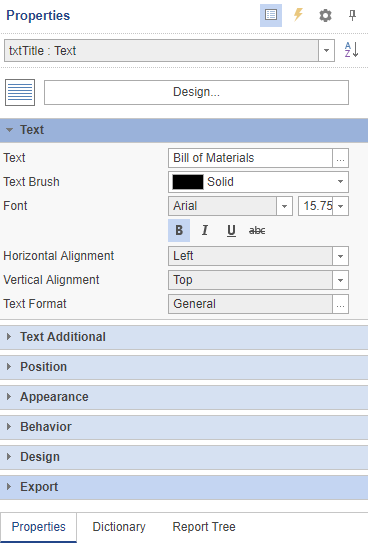
This panel is used to edit the appearance and behavior of elements found on a report.
The Properties Panel is a great way to see the values associated with existing objects in order to determine how to format new objects that are added to a report so that they match.
The Dictionary panel shows the connected data sources available for use, system variables, and functions.
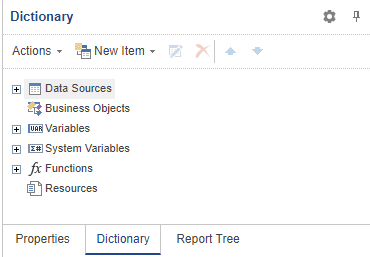
This panel is used when adding data from JobBOSS2 onto a report.
Report Tree Panel
This panel displays the components of the report in the form of a "directory tree". This is also referred to as displaying the report hierarchy.
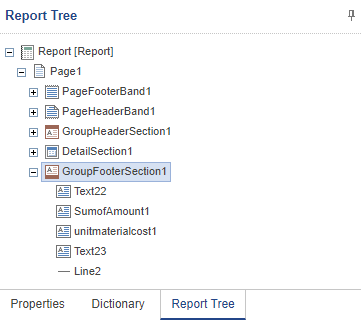
This panel is used to see how the various elements of a report are laid our and how they relate to each other.
The Toolbox
The Toolbox contains the main tools used in creating reports and is located on the left edge of the UI for easy access.
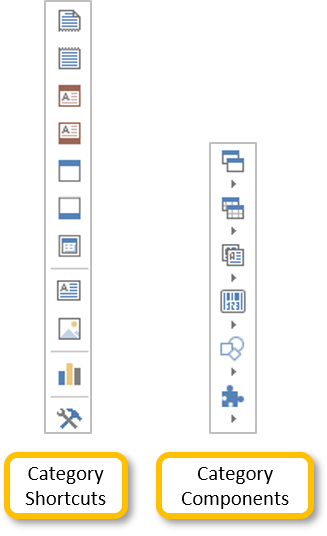
The Toolbox is used to select the various tools and features that are most commonly related to creating and / or editing a report.
The Report Workspace
The Report Workspace is the area located in the center of the browser window where the results of the various actions taken are displayed and report information is edited.
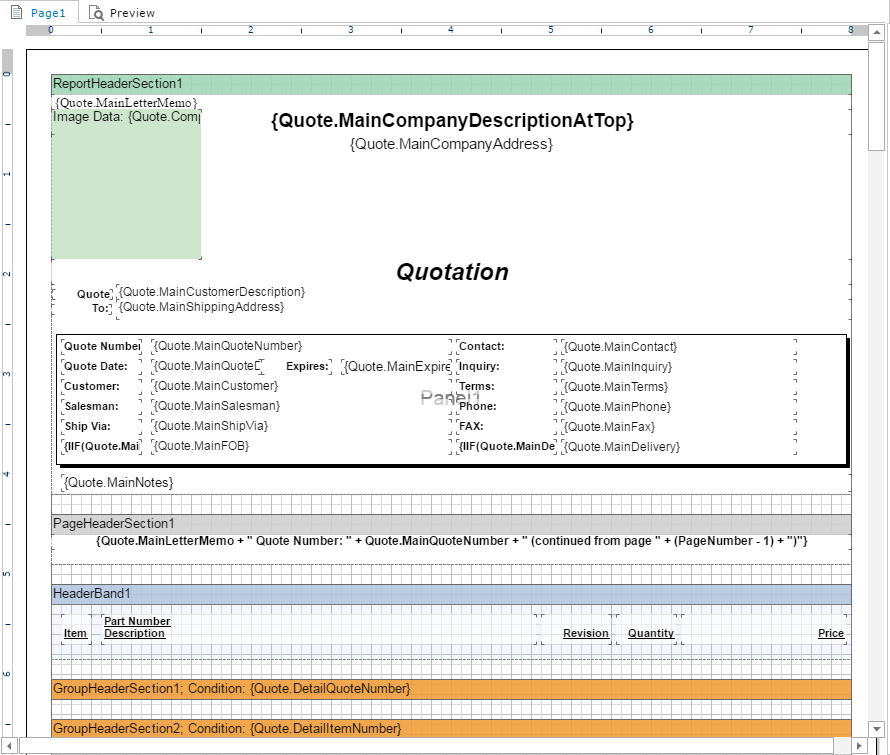
Report Sections
A blank report will display as a grid, like graph paper. As components and objects are added, they cover the grid and are placed into a Section or Band based on what the object does, where it should appear, and how often. Each Section / Band is displayed in a different color for reference.
Click the Bands button  in the Toolbox bar (located on the left edge of the UI) to see a description of each Section / Band.
- Report Title - This band is output at the beginning of the report.
- Report Summary - This band is used to output summaries throughout the entire report.
- Page Header - Objects placed in this section appear at the top of each page of the report. Page numbers and dates or other information are often added to this section.
- Page Footer - Placing objects in this section will cause them to print at the bottom of each page of the report. Page numbers and dates are commonly found in this section.
- Group Header and Group Footer - Not every report will have grouping sections. Objects placed in either of these sections will either print at the beginning of the section (above the Details) or at the end of the section (after the Data).
- Header - Used in conjunction with the Data band below. Typically column or data labels are placed in this section.
- Footer - Often used to output summary information from the Data band. Totals and Subtotals are frequently placed in this section.
- Column Header - This band is used to output column headers. All components which are placed on the band can be output above each column.
- Column Footer - This band is used to output footers of columns on the Data band. All components which are placed on this band will also be output under each column.
- Data - This section is used for the body of the report, and is printed once per record. This is where the data fields for the report should be located as the bulk of the report data appears in this section. This information (database fields and text) prints for every record selected on the report.
- Hierarchical Data - This band is connected to the data source and output as many times as there are rows in the data source. Data are output as a tree.
- Child - The Child band can be used to output two bands on one data row.
- Empty Data - This band is used to fill free space on the bottom of a page. This band fills free space on each page of a report.
- Overlay - This band is used to output watermarks on a page.
Selecting, Moving, and Resizing Objects
Objects placed on a report - such as database fields, formulas, images, and text boxes - can be selected by left clicking on it with the mouse. Selected objects display with square "handles" on the corners and sides like this:
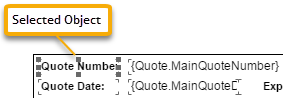
Once selected, an object can be moved to a different position by dragging it with the mouse (while holding the left mouse button) or resized by "grabbing" one of the handles with the mouse and dragging it.
When moving an object, the "handles" will not be visible, indicating the entire object has been "grabbed" as opposed to a single corner or side.
To group multiple objects together, click on each one with the mouse while holding down the CRTL key on the keyboard.
If objects are selected that are not next to each other, ALL the objects "in between" will also be included in the group.
The entire group is treated as a single object for purposes of being moved or resized, allowing for all the objects to be manipulated at the same time.
When moving or resizing objects, take care not to cover or otherwise obscure other objects on the report.
To deselect an object, click in an empty area of the report layout.
Support and Custom Development Requests
Support Provided by ECI Software Solutions, Inc.
As noted elsewhere, the ability to modify reports within JobBOSS2 is possible through the use of a third party application. This means the ability for ECI Software Solutions, Inc. to provide support for such actions is limited to the following items per the ECI Software Solutions, Inc. Service Level Agreement:
- Accessing the Report Designer - "How do I access the Report Designer JobBOSS2?"
- General usage of the Report Designer - "How do I save a modified report?" or "How do I print / edit a modified report?"
- Basic formatting issues related to fonts, field positions, logos, and other simple modifications - "How do I add a new / delete an existing object?" or "How do I change the font on this field?" or "How do I add a logo to this report?"
More advanced assistance in the use of the Report Designer or the creation of a report can be quoted by ECI Software Solutions, Inc.'s Custom Development Team.
Custom Development Requests
If the information provided here is not sufficient to get the desired results, consider having ECI's Custom Development team make the modifications for you. Options for submitting a Custom Development request include:
- Calling JobBOSS2 at 1-800-677-9640.
- Logging in to the Customer Community and submitting a new Support Case.
Regardless the option used, be sure to include the following information:
- The name of the report to be modified
- A description of the changes to be made
- An attachment showing a marked up example of how you want the report to appear
- Any other specifics like paper or label sizes, image files, or special fonts that should be used
- Please note that the Report Designer is a third party tool and is not an application created by ECI Software Solutions, Inc.. As such, support is able to provide very limited assistance with its use.
Reports created by ECI Software Solutions, Inc.'s Custom Development Team cannot be edited or modified using the Report Designer.