Appendix
Using the Report Designer
This topic provides step-by-step examples on some of the more common uses of the inline Report Designer tool in relation to reports located in JobBOSS2. For information regarding the layout, features, and functionality available with this tool, please see Report Designer Reference Information in the Help File.
Unless otherwise indicated, the exercises included here are performed using the Quote form. Though these exercises can be reviewed and followed in any order, using the same report makes it easier to create one or two "test" reports that can be used multiple times to prevent your custom report list from becoming cluttered.
Click an option below to see details on how to perform the listed action.
 Accessing the Report Designer
The Report Designer is available for use on any report or form that can be generated from within JobBOSS2. The Quote form is used here as an example.
- In the Navigation Sidebar, click the Data Entry button.

- Open the Quoting drop down menu.
- Select Quotations.
- Select a Quote from the Quotations Navigator Grid.
- The Report Designer will not open if a record has not been selected.
- Click Print (located at the top of the page.)
-Small.png)
- Click Quote.
- Click Single Quote (green button.)
- Click Design.
Users must have the option to create custom reports enabled in order to access the Report Designer.
- Click the Settings button.

- Open the System dropdown menu.
- Select User Maintenance.
- Select the user from the User Grid.
- Click Edit (located at the top of the page.)
- Navigate to the Misc. Settings Section.
- Place a check in "Allow user to create custom reports".
- When blank users will not see the Design option when generating reports.
- Click Save to save the change.
The Report Designer tool opens in a separate browser tab, displaying the Report Designer User Interface.
Though the path to get there will vary, clicking "Design" when selecting an output option will open the Report Designer for the selected report, form, or label.
Editing the Layout (Adding, Resizing, Moving, and Formatting an Object)
The most basic thing that can be done to a report is to change the way it looks. This exercise covers multiple basic aspects of modifying the layout and look of the Quote form.
- Open the Report Designer for the Quote form.
- See Accessing the Report Designer above for details on how to open the designer tool for a Quote
- If a modified report has already been created from another exercise, it can be selected for continued use. See Printing / Editing a Modified Report below for details on selecting a custom report if needed.
The exercise will begin by adding a text box where the company's website can be displayed.
- In the Toolbox locate and click the Text button.

- The cursor turns into a pencil icon.
- Move the "pencil" over the ReportHeaderSection1 area (top of report) and click the left mouse button (LMB) to place the text object.
- The Expression Editor opens, with the Expression Tab active.
- The pencil icon goes away and is replaced by the "standard" cursor.
- On the Expression Tab, replace the automatically entered text with the company website address.
- Example: www.mycompany.com
- Click OK.
- Right click on a label.
- Click Copy.
- Right click once more.
- Click Paste.
- Position the mouse in the desired location and click the left mouse button to "drop" the field.
- Double click the text object to open the Expression Editor.
- Edit the text as appropriate and click OK.
Resize an Object
The default size of the new object is likely not large enough to display the information, but it can be resized easily enough.
- Click the handle on the left or right edge of the text object and drag it until the entire web address is visible.
- If the object's height needs increased / decreased, grab either the top or bottom handle and drag it accordingly.
- To increase / decrease both height and width simultaneously, click a handle in one of the corners and drag accordingly.
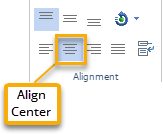
To have the text be in the exact center of the page, drag the right and left handles to their respective edges and then click the "Align Center" button in the Alignment frame of the Home Tab of the Ribbon menu.
Reposition an Object
If the text object is not located exactly where it should be, it can be dragged to a different position.
- Left click on the text object.
- If the object was already selected, the handles disappear, indicating the entire object has been "grabbed" as opposed to just one side / corner.
- When an object is selected, its position coordinates will also display at the bottom of the screen for reference.
- While holding down the LMB, move the new text object so that it is just above the existing text “Quotation” with just a little space between the two.
- When it is positioned correctly, release the LMB.
Depending on where an object is being placed or moved to, other objects may have to be adjusted as well. In the Quote form, assume an object needs to be placed in the Rectangle Component that holds the Quote Number, Quote Date, and Customer information. Since that object is already full, its height needs to be increased, but there are other objects already above and below it. In order to prevent crowding those objects, the entire Report Header (ReportHeaderSection1) that the Rectangle Component is in needs to be increased in size and at least one of the other existing objects needs to be moved.
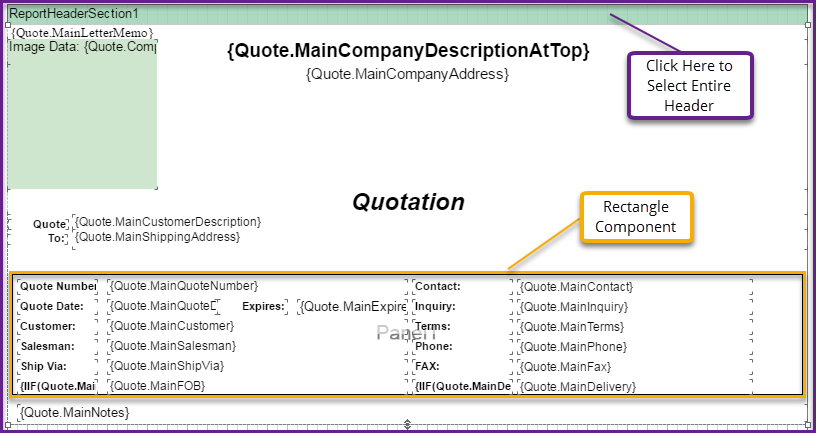
- Click in the ReportHeaderSection1 band located at the top of the report.
- It is the narrow, green rectangle in the image above.
- This selects the large rectangular area that begins at the top of the ReportHeaderSection1, goes down both sides of the report area and finishes just under the {Quote.MainNotes} Data Column (outlined in purple in the image above.)
- Click the handle at the bottom of the Report Header and drag it downward a little.
The Report Header is now large enough, however the "Quote.MainNotes" text object is still in the way.
- Click the Quote.MainNotes Data Column and reposition it a little farther down the form.
- This object is not being resized, it is being moved.
- Click the outer edge of the Rectangle Component the new object should go in (outlined in orange in the image above.)
- Clicking inside the Rectangle Component will cause an individual Data Column to be selected instead.
- Click the handle on the bottom of the Rectangle Component and drag it down, stopping just above the Quote.MainNotes Data Column moved previously.
When moving or resizing objects, take care not to cover or otherwise obscure other objects on the report.
An object can now be added or moved into the Rectangle Component without covering an existing object.
Add a New Font to the Report Designer
- Open the Dictionary Panel.
- Right-click on Resources and select New Resource.
- Rename the resource to the Font name.
- Change the Alias to the Font name as well.
- Select the Open Folder icon and navigate to your font file.
- Select the font, select Open, and click OK.
Your should now see the font file listed under Resources and the font has now been added to JobBOSS2.
Change the Font Characteristics of an Object
Sometimes the font of an object may need to be edited.
- Select the new text object with the website address (if it is not already selected.)
- In the Font frame of the Ribbon Menu, locate and click the Text Color button.
- Select a color that will be easy to recognize when the modified report is generated, such as blue or red.
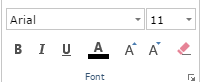
- In the same frame of the Ribbon Menu, click the Font Size dropdown menu and change the size to 11 to match the rest of the address object.
- If this makes the web address too large to be seen in its entirety again, resize the text object once more.
Assume the web address should be available to use as a link to the company website when the report is saved as a file or sent as an attachment in an email.
- Select the web address text object.
- In the Properties Panel, locate and expand the Interaction option.
- This is located under Behavior - you may need to scroll down the Panel sidebar to see it
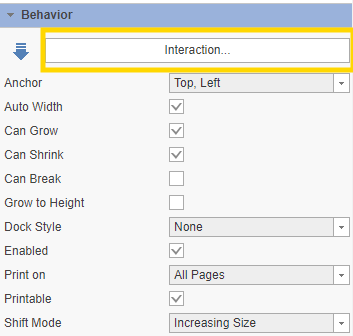
- Click Hyperlink.
- Enter the appropriate URL in the Expression Editor when it opens.
- Click OK.
In many instances, there may be more than one way to accomplish the same goal. For example, the font changes made above could also have been done in the Properties Panel under the Text option. With a little experience and some practice you will find the options that work best for you.
- Select the desired text object in the Report Workspace.
- Click the Properties Tab in the Panel.
- Expand the Text option (at the top) if it is not already expanded.
Change Font Color
- Expand Text Brush.
- Click Color.
- Select the desired color from the dropdown menu provided.
Change Font Size and other Characteristics
- Expand Font.
- Click Size.
- For this, actually click in the field where the numeric value is listed (on the right)
- Enter the desired size. (11 in the example above)
Most options will provide dropdown menus from which the desired selection can be made, but some, such as size, do require a value to be entered directly.
When deciding whether text will display a certain way, such as bold or underline, the options will be "True" (Will be bold; Will be underlined) or "False" (Will NOT be bold; Will NOT be underlined, etc.)
The Properties Panel is also a great way to see the values associated with existing objects in order to determine how to format new objects that are added to a report.
Those are all the layout changes to be made for now.
- Save the report. (See Saving a Modified Report below for details if needed.)
- Close the Report Designer tab in the browser window.
Adding an Image
The image must be saved within the dictionary before beginning the following instructions.
- Open the Report Designer for the Quote form.
- See Accessing the Report Designer above for details on how to open the designer tool for a Quote.
- If a modified report has already been created from another exercise, it can be selected for continued use. See Printing / Editing a Modified Report below for details on selecting a custom report if needed.
- Open the Dictionary tab at the bottom of the panel.
- Expand the Data Source menu.
- Expand the _Data menu.
- Expand the JTHEADING menu.
- Select your image and drag it onto the report.
- Align the image to your liking.
- Save the report. (See Saving a Modified Report below for details if needed.)
- Close the Report Designer for the form.
Inserting Data
This process is not covered in your Support contract. If you are in need of other resources, the Online Help for Report Designer is available for your use. Please refrain from calling the Report Designer support line, as that service is reserved for their direct customers.
This example will demonstrate how to modify a report by adding data that is stored in the same table as other values already displayed but is not included in the standard version of the report.
- Open the Report Designer for the Quote form.
- See Accessing the Report Designer above for details on how to open the designer tool for a Quote.
- If a modified report has already been created from another exercise, it can be selected for continued use. See Printing / Editing a Modified Report below for details on selecting a custom report if needed.
Locate Data Sources
- Click the Dictionary Tab of the Panel tool.
- Expand Data Sources.
- The Data Columns available here will be aggregated from the Quotation tables in the database.
Two entries are displayed in the Data Source Tree:
- E2DB[SQL Connection] - A link provided to access any table in the database, not just ones that are used to generate the report
- _Data - Displays Data Columns already on the report or that are available by default to be used on the report
In some cases there may be more than two entries.
These Data Columns may or may not map to single fields on the record; much of the time these values are generated when running the report and are temporarily stored in the computer’s memory. Examples of this on the Quote include:
- {Quote.MainCompanyAddress}
- The individual fields which make up the Location address that is selected when the report is generated are combined together, properly formatted, and then printed on the report as one combined Data Column.
- {Quote.DetailPartNumber}
- Part Number and Part Description are combined into one field.
Add Data Field ("Bill To" Address)
- On the Dictionary Tab of the Panel, expand the _Data connection.
- Expand the Quote table.
- From the resulting list look for MainBillTo.
- Entries can be rearranged.
- Left click on the entry.
- Holding the left mouse button down, drag and drop it below the “Quotation” header, to the right of the “Quote To” fields.
- The MainBillTo entry does not get removed from the list.
- Once the entry is over the Report Workspace, the data object can be seen along with the position coordinates as it is moved.
- A Data Column can be added to a report multiple times.
- The Report Designer adds both the Data Column and a default label for it.
- The default label text does not contain spaces and needs to be edited.
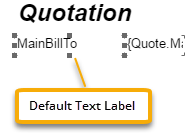
- Right click on the label.
- Select Design from the menu.
- In the Expression Editor, change this text to "Bill To:".
- You may need to click the Expression tab before you can make the change.
- Click OK.
Once on the report, objects can be edited for formatting purposes.
- In this example, the font of the "Bill To" field should be changed to match the text object of the "Quote To" field located to the left:
- Font size = 8.1 pt
- Bold
- Additionally, the information that will display in the {Quote.MainBillTo} Data Column itself should be the following:
- Font size = 9 pt
See Change the Font Characteristics of an Object in Editing the Layout above for details if needed.
- In this example, the font of the "Bill To" field should be changed to match the text object of the "Quote To" field located to the left:
- Save the report. (See Saving a Modified Report below for details if needed.)
- Close the Report Designer tab in the browser window.
Linking Additional Tables
This process is not covered in your Support contract. If you are in need of other resources, the Online Help for Report Designer is available for your use. Please refrain from calling the Report Designer support line, as that service is reserved for their direct customers.
This example will demonstrate how to link information from a table that is not associated with the selected record by default, and is therefore not displayed on the standard version of the report. Specifically it will pull information from a User Defined Field associated with the CustCode (Customer) table.
Example Prerequisites
In order to follow this example, there are a couple things that need to be in place first.
Verify User Defined Values are Available
Edit an existing Customer Code or create a new one and enter some text into the User Defined Text 1 field.
It is possible that this field is already being used, meaning the label may have been changed to something specific to your organization. If this is the case, make note of the value entered and the label provided so it can be located in the example. Another option would be to use a different User Defined Field - such as User Defined Text 2 - and simply select that in place of the one referenced in the example.
Next, create a new Quote for the Customer that was just edited / created; it does not matter what Part is selected.
It is not necessary in this exercise for the User Defined Text 1 field to be populated on the Quote since the information will not be pulled from there.
Save the Quote. Now the desired information can be linked to the Quote form.
- Open the Report Designer for the Quote form.
- See Accessing the Report Designer above for details on how to open the designer tool for a Quote if needed.
- If a modified report has already been created from another exercise, it can be selected for continued use. See Printing / Editing a Modified Report below for details on selecting a custom report if needed.
Locate Data Sources
- Click the Dictionary Tab of the Panel tool.
- Expand Data Sources.
- Right click on E2DB[SQL Connection].
- Click New Data Source.
- On the "Select Type of Data" screen that opens, place a check in the box to Skip Schema.
- Once you check this box once, it will remain checked.
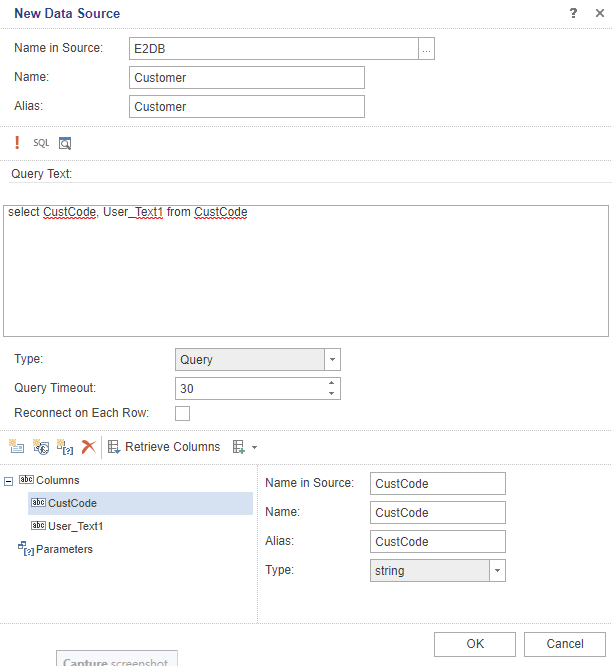
- Select E2DB under the Report Connections section.
- Edit the Name field to Customer.
- The Alias field automatically changes to Customer as well when another area on the window is selected.
- Click in the Query Text field.
- Enter the following text:
- select CustCode, User_Text1 from CustCode
- Click Retrieve Columns.
- Click OK.
Unless every field in the table to be added is required on the report, avoid using the asterisk (*) wildcard in the query. It is better to only use the fields required for joining the table(s) added to the data already in the report and the fields to be added. The asterisk could be used in the query the first time columns are retrieved to get the names of the fields that are available in the table, but it is recommended that the query then be edited to only include the required columns and the columns retrieved a second time.
Add Data Field
- Right click on the newly created Customer data source.
- Click New Relation.
- Optional: Change the value in the following fields:
- Name in Source
- Name
- Alias
- This could make adding fields from the correct Relation easier if there are going to be several relations in the report, but is not necessary.
- Open the Parent DataSource dropdown menu.
- Select Customer.
- This populates the list of columns in the right box under Parent Columns with fields in the Customer data source.
- Open the Child Data Source dropdown menu.
- Select Quote.
- This populates the list of columns in the right box under Child Columns with fields in the Quote data source.
- From the available Parent Columns (located in the box on the right), select CustCode.
- You may need to scroll down the list to locate this column.
- When you click the item, you will see a small number 1 appear alongside it in the row.
- From the available Child Columns (located in the box on the right), select MainCustomer.
- A number 1 appears alongside this item as well to indicate that the two items are joined.
- Click OK.
- Select the User_Text1 field that now appears under the Relation that was just created.
- For reference this will be located under Data Sources > E2DB[SQL_Connection] > Customer in the Dictionary Panel.
- It does not matter what Quote was selected to edit the form; however, only Quotes for a Customer that has a value in the selected field (User_Text1) in this example) will display a value on a printed Quote.
- Hold down the left mouse button to drag this field onto the report and drop it in the desired location.
- By default this will create a label that will likely need to be edited by way of verbiage and format. See Editing the Layout above for details on how to do so if needed.
- Save the report. (See Saving a Modified Report below for details if needed.)
- Close the Report Designer tab in the browser window.
Adding a Formula and Providing Conditional Formatting
This example will demonstrate how to create or edit a formula on a report. Specifically, it will show how to add a formula to the Quote form that will multiply the Price by the Quantity Break to provide an Extended Price the Customer would pay. In addition, it will show how to edit the formula so that values in excess of a specified dollar amount will display in a different color.
- Open the Report Designer for the Quote form.
- See Accessing the Report Designer above for details on how to open the designer tool for a Quote.
- If a modified report has already been created from another exercise, it can be selected for continued use. See Printing / Editing a Modified Report below for details on selecting a custom report if needed.
Adding the Formula
- In the Toolbox locate and click the Text button.
- The cursor turns into a pencil icon.
- Move the "pencil" over the section of the report where the formula will be placed and click the left mouse button to place the text object.
- The Expression Editor opens, with the Expression Tab active.
- The pencil icon goes away and is replaced by the "standard" cursor.
- Though the formula can be placed anywhere, a logical location would be in the DataBand1 section of the report. For example:
- Reposition the {Quote.DetailRevision}, {Quote.DetailQuantity}, and the /{Quote.DetailUnit} objects to the left.
- Reduce the width of objects to make some additional space if needed.
- See Editing the Layout above for details on how to perform these actions if needed.
- On the Expression Tab, clear the automatically entered text.
- Expand Data Sources in the Dictionary pane on the left hand side of the screen (outside the Expressions box).
- Expand _Data.
- Expand Quote.
- Double click on DetailPrice and again on DetailQuantity.
- Double clicking on these items places them in the Expression Editor box.
- In the main area of the Expression Editor, remove the “}{“ characters between the two Data Columns and replace them with an asterisk “*” character.
- The asterisk is used for multiplication in formulas.
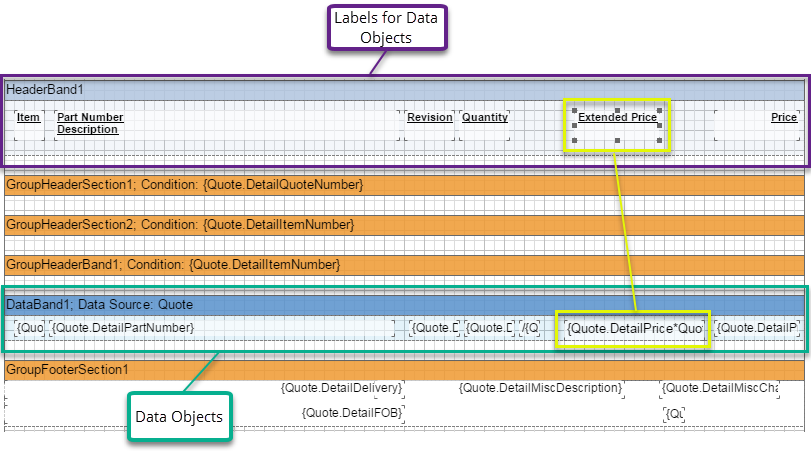
- The formula should look like this: {Quote.DetailPrice*Quote.DetailQuantity}
The brace symbols, “{“ and “}”, are used to indicate where a function or operation begins and ends. Without these braces the value displayed would just be the text “Quote.DetailPrice*Quote.DetailQuantity” as opposed to a numeric value based on the result of the calculation.
- Click OK.
- Adjust the position, font size, and alignment of this object to match other Data Columns that are on the report.
- Change the Text Format of the field to make it Currency instead of General.
- Reposition the labels found in the HeaderBand1 section to align them with the corresponding Data Columns in the DataBand1 section below.
- Add a label for the new formula in the Header Band.
- Could add a new label or copy and edit an existing one
- Suggested verbiage for new label would be "Extended Price"
- See Editing the Layout above for details on how to perform these actions if needed.
Applying Conditional Formatting to the Formula
- Left click on the formula added to calculate extended price.
- Select the formula itself (located in the Data Band), not the label in the Header Band.
- In the Style frame of the Ribbon Menu, locate and click the Conditions button.

- Click Add Condition.
- Select Highlight Condition from the dropdown menu.
- Change the “Field Is” setting from Value to Expression.
- Enter the formula used above and include the operation that the result is greater than 100. It should look like this:
- Quote.DetailPrice*Quote.DetailQuantity>100
- Set the font color to something other than black (the standard color.)
- Click OK.
- Save the report. (See Saving a Modified Report below for details if needed.)
- Close the Report Designer tab in the browser window.
Adding Summary Fields
This example will demonstrate how to use the summary field to tally results located in a report. Specifically, it will show how to add summary fields for multiple quantities located on the P.O. Summary.
This example modifies the Purchase Order Summary as opposed to the Quote form itself.
- Open the Report Designer for the P.O. Summary.
- Make sure the Detail option is selected in the "Include These Reports" box.
- If a custom version of the P.O. Summary already exists as a result of an earlier exercise, it can be selected for continued use. See Printing / Editing a Modified Report below for details on selecting a custom report if needed.
- In the Navigation Sidebar, click the Reports button.

- Open the Purchasing dropdown menu.
- Select Purchase Order Summary.
- Click Generate Report.
- Select Design from the dropdown menu.
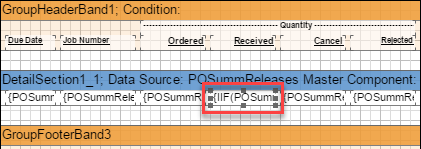
The P.O. Summary has two summary fields already present, acting as a Subtotal and Total. In addition, it has a Subreport, which is where this example will begin.
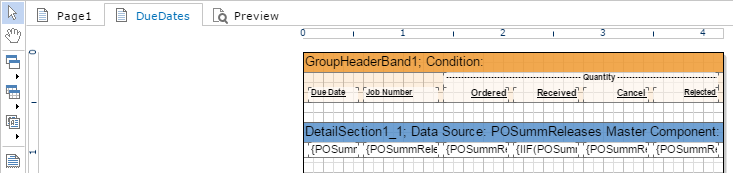
- Click the Due Dates Tab.
- This is located at the top of the Report Workspace and is where the Subreport is found.
A total of five Text Objects will be added to the Group Footer in this portion of the example.
- In the Toolbox locate and click the Bands button.

- Select Group Footer from the dropdown menu.
- The cursor turns into a pencil icon.
- Move the "pencil" over the workspace below the DetailSection1_1 band and click the left mouse button to place the Group Footer Band.
- The pencil icon goes away and is replaced by the "standard" cursor.
- Also from the Toolbox, locate and click the Text button.
- Place the new Text Object in the Group Footer Band.
- Type "Totals" into the Expression Text box that appears.
- Move the Totals Text Object so that it is directly below the "Job Number" label located in GroupHeaderBand1.
- Add a second Text Object to the Group Footer.
- This object could be added new or copied from the first one added.
- Place the second Object in the Group Footer Band below the "Ordered" label located in GroupHeaderBand1.
- Click the Summary Tab on the right of the Expression Editor.
- Open the Summary Function dropdown menu.
- Select Sum.
- This option may already be selected by default.
- Open the Data Band dropdown menu.
- Select DetailSection1_1.
- Open the Data Column dropdown menu.
- Expand POSummReleases.
- Double click Qty to select it.
- Selecting Qty and clicking OK may not actually select the value for the Expression Editor.
- The "Summary Running" value should be set to Report (radio button selection.)
- Click OK.
- Double click this field again.
- Click the Expression Tab on the left of the Expression Editor to see the actual expression that will be used. It should look like this:
- {Sum(DetailSection1_1,POSummReleases.Qty)}
- Add a third Text Object to the Group Footer.
- Place this Object in the Group Footer Band below the "Received" label located in GroupHeaderBand1.
- This total requires the expression used to calculate the field in the DetailSection1_1.
- Click on the Data field located under the Received label.
- As noted above, this field is located in the DetailSection1_1.
- Double click the field to open the Expression Editor.
- Copy the expression to the Clipboard.
- Click Cancel.
- Double click the third Text Object placed in the Group Footer Band (located under the Received label.)
- Paste the copied Expression into this expression field replacing the text that is there by default. This should be:
- {IIF(POSumm.QtyReceived == null,0,POSummReleases.Qty - POSummReleases.QtyCanceled)}
This expression needs some editing in order to turn it into a summary field.
- Type {Sum at the beginning of the expression.
- There should be no space after Sum.
- Replace the left brace “{“ located in front of the “IIF” text with a left parenthesis “(“.
- Insert a right parenthesis “)” at the end of the expression, between the existing right parenthesis and the right brace. The expression should look like this:
- {Sum(IIF(POSumm.QtyReceived == 0,0,POSummReleases.Qty - POSummReleases.QtyCanceled))}
- Click OK.
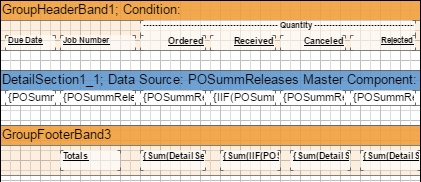
The Canceled and Rejected fields are similar to the Qty field first added to the Grou Footer Band. Refer to steps 10 through 24 for the remaining two fields, replacing the {POSummReleases.Qty} field with the {POSummReleases.QtyCanceled} and the {POSummReleases.QtyRejected} fields for the Data Columns, respectively.
- Optional: Modify the appearance of the new fields in the to match other labels in the report.
- See Editing the Layout above for details on how to perform these actions if needed.
When finished, it should look something like this:
- Save the report. (See Saving a Modified Report below for details if needed.)
- Close the Report Designer tab in the browser window.
Sorting and Grouping
This example will demonstrate how to change the way in which the results of a report are organized for display purposes. Specifically it will change the primary sort from the PO Number to the Vendor Code, in ascending order.
This example modifies the Purchase Order Summary as opposed to the Quote form itself.
- Open the Report Designer for the P.O. Summary.
- Make sure the Detail option is selected in the "Include These Reports" box.
- If a custom version of the P.O. Summary already exists as a result of an earlier exercise, it can be selected for continued use. See Printing / Editing a Modified Report below for details on selecting a custom report if needed.
- In the Navigation Sidebar, click the Reports button.
- Open the Purchasing dropdown menu.
- Select Purchase Order Summary.
- Click Generate Report.
- Select Design from the dropdown menu.
- Double click on the GroupHeaderSection1 band.
- This represents the primary grouping of the report.
- Select the Data Column tab on to the right of the pane.
- Select VendCode from the list provided.
- Click OK.
- You have now established the group.
- Double click on the DataBand1 band.
- Select the Sort tab to the right of the pane.
- Click the ellipse button.

- Select the item by which you want to sort the group.
- Click OK.
- Save the report. (See Saving a Modified Report below for details if needed.)
- Close the Report Designer tab in the browser window.
Adding System Variables
The Report Writer includes many special, built-in functions that will make it simpler on the person modifying a report within JobBOSS2 by helping reduce the time it takes to make the report presentable.
Some of the more commonly used System Variables are:
- Line: Returns the line number on the report
- Page Number: prints the current page number
- Page N of M: prints the current page number of the total number of pages
- Total Page Count: prints the total number of pages in the report
- Is First Page: Returns True on the first page of the report or False on subsequent pages
- Could be used with conditional formatting to have objects print only on the first page
- Is Last Page: Similar to the first page one; prints False on all pages except the last page where True is returned
- Today: Returns the system date of the computer running the report. If the time is displayed through the formatting of the field then midnight will be included
- Time: Prints the date and time the report was run depending on the formatting of the field
To add a system variable to a report:
- In the Toolbox locate and click the Text button.
- The cursor turns into a pencil icon.
- Move the "pencil" over the section of the report where the formula will be placed and click the left mouse button to place the text object.
- The Expression Editor opens, with the Expression Tab active.
- The pencil icon goes away and is replaced by the "standard" cursor.
- Click System Variable Tab on the right of the Expression Editor.
- Double click on the desired variable to select it.
Saving a Modified Report
To save a modified report:
- Click the Save Report icon.
- Provide a File Name in the Save Report prompt that appears.
- Provide a name that helps identify what the modified report was designed to do since this is the value that will be used to select the report / form for use in the future.
- A modified report cannot overwrite a standard report included with JobBOSS2.
- If an existing modified report is being edited, saving it by the same name will overwrite the previous version of the modified report.
- Saving it with a different name will create another modified report that would be available to generate.
- Click Save.
- A prompt appears notifying the user the "report was successfully saved."
- Click OK.
Standard reports cannot be removed by saving a modified report with the same "standard" name, meaning standard reports will always be available for use.
Modified reports can be accessed for generating or editing by selecting them in the "Custom" dropdown menu that will appear in the Print Spool window once a modified report has been created / saved.
Printing / Editing a Modified Report
Once a modified report has been created and saved, it is accessed in the same way whether the user wants to generate it or edit it. This example uses a modified Quote.
- In the Navigation Sidebar, click the Data Entry button.
- Open the Quoting drop down menu.
- Select Quotations.
- Select a Quote from the Quotations Navigator Grid.
- The Report Designer will not open if a record has not been selected.
- Click Print (located at the top of the page.)
- Click Quote.
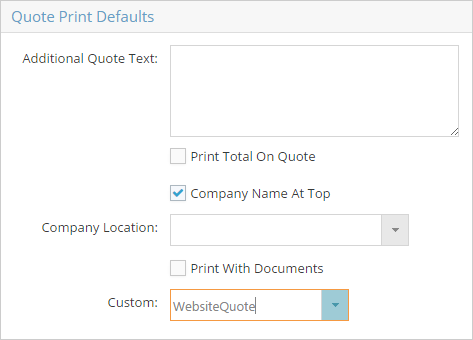
- In the Quote Print Defaults frame at the bottom of the page, click the Custom dropdown menu.
- The Custom dropdown will not be present if there are no modified reports associated with the selected Print Spool
- The location of the Custom dropdown will vary depending on the layout of the Print Spool selected
- Select the desired custom report.
- Click Single Quote (green button.)
- Click the appropriate option based on what needs to be done with the custom report:
- View / Print
- Export
- Design
Depending on the nature of the edit, make sure the appropriate options are selected when generating the report. For example, if the Report Header was edited, the changes will not display unless the option for Company Name At Top is selected in this instance.
Deleting / Renaming a Modified Report
Deleting and / or renaming a modified report is accomplished in the System Custom Reports option as opposed to within the Report Designer application.
- In the Navigation Sidebar, click the Settings button.
- Open the System drop down menu.
- Select Custom Reports.
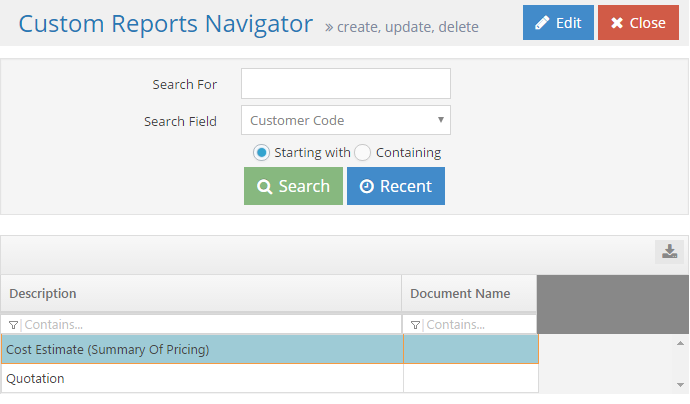
- Click Search to populate the Custom Reports Navigator Grid.
- This populates the grid with all custom reports by default.
- The Search For and Search Field options at the top of the form and the in-grid filters can be used to narrow the list if needed.
- Select a custom report from the grid.
- Click Edit (located at the top of the page.)
- A list of modified reports is displayed for the area selected
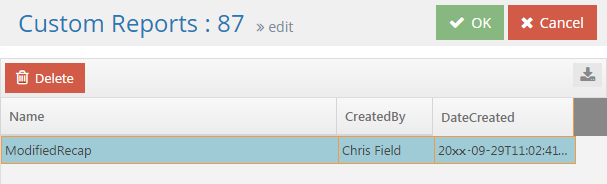
- Select the report that needs to be deleted or renamed.
- To delete the report, simply click the Delete button.
- To rename the report, double click on the report Name and overwrite the existing value with a new one.
- Click OK.
- Click Close in the Navigator screen.